Delaware Valley
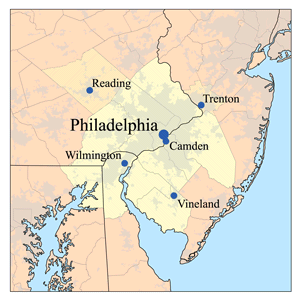
Delaware Valley is the regional name for the Philadelphia-Camden-Wilmington Metropolitan Area which is a 5,000 square mile area which includes 9 counties within 35 miles of the City of Wilmington
Population
Back To Top
Population
| Population | 2000 | 2010 | 2023 | 2028 |
|---|---|---|---|---|
| Delaware Valley | 5,828,268 | 6,116,820 | 6,440,739 | 6,479,696 |
Source: ESRI, 2023-10-17
Population by Age
| Population | 2010 | 2023 | 2028 |
|---|---|---|---|
| 0-4 | 378,523 | 342,538 | 348,762 |
| 5-9 | 386,684 | 374,607 | 359,267 |
| 10-14 | 401,764 | 399,829 | 382,164 |
| 15-19 | 443,187 | 410,762 | 397,815 |
| 20-24 | 431,913 | 408,074 | 398,537 |
| 25-29 | 412,824 | 423,038 | 398,743 |
| 30-34 | 380,582 | 450,264 | 431,158 |
| 35-39 | 384,891 | 427,917 | 465,289 |
| 40-44 | 425,388 | 407,872 | 432,992 |
| 45-49 | 469,358 | 372,181 | 404,471 |
| 50-54 | 464,905 | 406,968 | 367,216 |
| 55-59 | 396,376 | 419,098 | 389,840 |
| 60-64 | 329,064 | 425,533 | 385,114 |
| 65-69 | 238,101 | 370,137 | 387,658 |
| 70-74 | 176,639 | 304,923 | 330,653 |
| 75-79 | 148,771 | 213,231 | 260,105 |
| 80-84 | 123,929 | 138,377 | 174,695 |
| 85+ | 123,922 | 145,389 | 165,217 |
| 18+ | 4,688,991 | 5,087,789 | 5,162,030 |
| Median Age | 38 | 40 | 41 |
Source: ESRI, 2023-10-17
Population by Race
| Delaware Valley | 2023 |
|---|---|
| Total | 6,440,739.00 |
| White Alone | 59.28 |
| Black Alone | 20.47 |
| American Indian Alone | 0.35 |
| Asian Alone | 6.88 |
| Pacific Islander Alone | 0.04 |
| Some Other Race | 5.77 |
| Two or More Races | 7.22 |
| Hispanic Origin | 11.49 |
| Diversity Index | 67.60 |
Source: ESRI, 2023-10-17
Growth Rate
| Delaware Valley | 2023 - 2028 |
|---|---|
| Population | 0.12% |
| Households | 0.40% |
| Families | 0.34% |
| Median Household Income | 3% |
| Per Capita Income | 3% |
Source: ESRI, 2023-10-17
Back To TopHousing
Back To Top
Households
| Population | 2000 | 2010 | 2023 | 2028 |
|---|---|---|---|---|
| Households | 2,181,099 | 2,309,574 | 2,504,158 | 2,554,274 |
| Housing Units | 2,332,039 | 2,486,445 | 2,687,182 | 2,737,692 |
| Owner Occupied Units | 1,674,371 | 1,715,682 | ||
| Renter Occupied Units | 829,787 | 838,592 | ||
| Vacant Units | 183,024 | 183,418 |
Source: ESRI, 2023-10-17
Home Value
| Delaware Valley | 2023 | 2028 |
|---|---|---|
| Median Home Value | $341,485 | $383,275 |
| Average Home Value | $384,247 | $423,644 |
| <$50,000 | 60,953 | 43,670 |
| $50,000 - $99,999 | 67,690 | 38,973 |
| $100,000 - $149,999 | 76,478 | 46,493 |
| $150,000 - $199,999 | 125,284 | 91,639 |
| $200,000 - $249,999 | 167,179 | 142,700 |
| $250,000 - $299,999 | 191,552 | 182,727 |
| $300,000 - $399,999 | 356,392 | 373,988 |
| $400,000 - $499,999 | 267,043 | 336,078 |
| $500,000 - $749,999 | 266,476 | 347,500 |
| $1,000,000 + | 22,639 | 25,922 |
Source: ESRI, 2023-10-17
Housing Year Built
| Year Range | Houses Built |
|---|---|
| 2010 or Later | 111,278 |
| 2000-2009 | 207,516 |
| 1990-1999 | 246,770 |
| 1980-1989 | 256,589 |
| 1970-1979 | 317,380 |
| 1960-1969 | 317,157 |
| 1950-1959 | 400,400 |
| 1940-1949 | 190,335 |
| 1939 or Before | 574,608 |
Source: ESRI, 2023-10-17
Back To TopIncome
Back To Top
Income
| Delaware Valley | 2023 | 2028 |
|---|---|---|
| Median Household | $82,951 | $95,823 |
| Average Household | $120,799 | $137,541 |
| Per Capita | $47,097 | $54,348 |
Source: ESRI, 2023-10-17
Household Income Base
| Delaware Valley | 2023 |
|---|---|
| <$15,000 | 240,560 |
| $15,000 - $24,999 | 152,151 |
| $25,000 - $34,999 | 157,944 |
| $35,000 - $49,999 | 222,972 |
| $50,000 - $74,999 | 364,544 |
| $75,000 - $99,999 | 300,295 |
| $100,000 - $149,999 | 452,836 |
| $150,000 - $199,999 | 270,245 |
| $200,000+ | 342,323 |
Source: ESRI, 2023-10-17
Back To TopEmployees
Back To Top
Commute
| Category | Commuters |
|---|---|
| Workers 16+ | 3,087,225 |
| In-County Residents | 2,020,986 |
| Out-of-County Residents | 767,002 |
| Drive Alone | 2,112,563 |
| Carpooled | 223,623 |
| Public Transport | 239,011 |
| Work at Home | 356,737 |
| Less than 5 minutes | 61,530 |
| 5-9 minutes | 204,087 |
| 10-14 minutes | 298,400 |
| 15-19 minutes | 360,169 |
| 20-24 minutes | 369,573 |
| 25-29 minutes | 191,053 |
| 30-34 minutes | 409,291 |
| 35-39 minutes | 101,132 |
| 40-44 minutes | 140,027 |
| 45-59 minutes | 300,635 |
| 60-89 minutes | 211,829 |
| 90+ minutes | 82,763 |
| Average Travel Time | 0 |
Source: ESRI, 2023-10-17
Source: ESRI, 2023-10-17
Employees by NAICS
| Category | Number |
|---|---|
| Total Employees | 3,111,296 |
| Agr/Forestry/Fish/Hunt | 10,238 |
| Mining | 1,426 |
| Utilities | 10,257 |
| Construction | 157,923 |
| Manufacturing | 222,109 |
| Wholesale Trade | 110,565 |
| Retail Trade | 366,624 |
| Motor Veh/Parts Dealers | 49,889 |
| Furn & Home Furnish Str | 15,099 |
| Electronics & Appl Store | 11,169 |
| Bldg Matl/Garden Equip | 31,959 |
| Food & Beverage Stores | 83,427 |
| Health/Pers Care Stores | 31,486 |
| Gasoline Stations | 7,572 |
| Clothing/Accessory Store | 31,829 |
| Sports/Hobby/Book/Music | 35,298 |
| General Merchandise Str | 68,895 |
| Misc Store Retailers | 0 |
| Nonstore Retailers | 0 |
| Transportation/Warehouse | 85,967 |
| Information | 93,131 |
| Finance & Insurance | 152,436 |
| Cntrl Bank/Crdt Intrmdtn | 43,048 |
| Sec/Cmdty Cntrct/Oth Inv | 57,412 |
| Insur/Funds/Trusts/Other | 51,975 |
| Real Estate/Rent/Leasing | 92,490 |
| Prof/Scientific/Tech Srv | 269,354 |
| Legal Services | 59,922 |
| Mgmt of Comp/Enterprises | 4,917 |
| Admin/Support/Waste Mgmt | 85,609 |
| Educational Services | 245,491 |
| HealthCare/Social Assist | 520,014 |
| Arts/Entertainment/Rec | 62,395 |
| Accommodation/Food Srvcs | 220,084 |
| Accommodation | 31,203 |
| Food Srv/Drinking Places | 188,882 |
| Other Srv excl Pub Admin | 203,018 |
| Auto Repair/Maintenance | 23,352 |
| Public Administration Emp | 176,405 |
Source: ESRI, 2023-10-17
Educational Attainment (25+)
| Delaware Valley | 2023 |
|---|---|
| Some High School | 209,617 |
| Graduated High School | 1,093,134 |
| Associates Degree | 372,175 |
| Bachelor's Degree | 1,117,211 |
| Graduate Degree | 777,989 |
Source: ESRI, 2023-10-17
Back To TopBusinesses
Back To Top
Businesses by NAICS
| Category | Number |
|---|---|
| Total Businesses | 221,934 |
| Agr/Forestry/Fish/Hunt Bus | 774 |
| Mining Bus | 161 |
| Utilities Bus | 237 |
| Construction Bus | 16,361 |
| Manufacturing Bus | 7,744 |
| Wholesale Trade Bus | 7,315 |
| Retail Trade Bus | 28,803 |
| Motor Veh/Parts Dealers Bus | 3,238 |
| Furn & Home Furnish Str Bus | 1,617 |
| Electronics & Appl Store Bus | 1,052 |
| Bldg Matl/Garden Equip Bus | 2,156 |
| Food & Beverage Stores Bus | 4,993 |
| Health/Pers Care Stores Bus | 3,158 |
| Gasoline Stations Bus | 1,024 |
| Clothing/Accessory Store Bus | 3,486 |
| Sports/Hobby/Book/Music Bus | 4,832 |
| General Merchandise Str Bus | 3,248 |
| Misc Store Retailers Bus | 0 |
| Nonstore Retailers Bus | 0 |
| Transportation/Warehouse Bus | 3,723 |
| Information Bus | 4,936 |
| Finance & Insurance Bus | 11,374 |
| Cntrl Bank/Crdt Intrmdtn Bus | 4,048 |
| Sec/Cmdty Cntrct/Oth Inv Bus | 3,328 |
| Insur/Funds/Trusts/Other Bus | 3,997 |
| Real Estate/Rent/Leasing Bus | 10,461 |
| Prof/Scientific/Tech Srv Bus | 23,111 |
| Legal Services Bus | 6,193 |
| Mgmt of Comp/Enterprises Bus | 462 |
| Admin/Support/Waste Mgmt Bus | 8,350 |
| Educational Services Bus | 6,536 |
| HealthCare/Social Assist Bus | 23,944 |
| Arts/Entertainment/Rec Bus | 4,682 |
| Accommodation/Food Srvcs Bus | 16,706 |
| Accommodation Bus | 1,044 |
| Food Srv/Drinking Places Bus | 15,662 |
| Other Srv excl Pub Admin Bus | 28,451 |
| Auto Repair/Maintenance Bus | 4,979 |
| Public Administration Bus | 4,963 |
Source: ESRI, 2023-10-17
Back To Top